How do Tesla and General Motors Technologies Differ?

wpengine
November 7, 2019
As reported by Reuters on 24th October 2019, Tesla’s shares gained 17% last week, as the company managed to achieve their targeted profits for the quarter. Due to this gain, Tesla’s market capitalization crossed that of General Motors’, a legacy manufacturer in the automotive industry. As explained in the report, this sudden increase in profits for Tesla was mainly due to the increased demand for Tesla cars. This news clearly highlights the trend that the automotive customer’s affinity has shifted from conventional combustion engine vehicles towards the more technologically advanced electric vehicles. Tesla being a pioneer in this segment has been hailed as the driving force behind this shift. On the heels of this news, we think it is of utmost importance that investors study the patent portfolios of these companies to understand where, how and by how much the two automotive technology developers differ from each other.
We performed the following analysis using our patented patent data analytics software, LexisNexis® PatentSight®. By selecting the portfolios of the two owners and using a variety of available charts and tables to draw insights from, we compared the portfolios of these innovation leaders to find answers to the questions we asked in the previous section. Read on to learn how Tesla was able to achieve this success based on the quality of the technology that they own.
Tesla vs General Motors – comparison of total portfolios
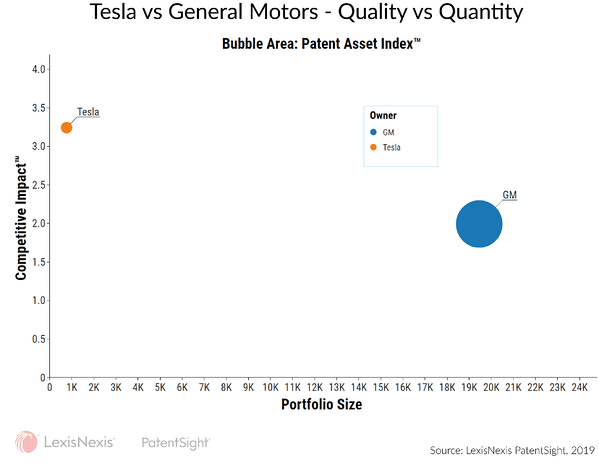
Simply by looking at the cumulative portfolios of both the companies, it becomes clear that while Tesla maintains a smaller portfolio (only 754 patents) as compared to GM (about 20,000 patents), Tesla’s portfolio of patents is miles or kilometres ahead of the latter’s, in average quality as indicated by our proprietary patent quality indicator Competitive Impact. The portfolio of Tesla has an average Competitive Impact value of almost 3.25, in comparison to the low value of 2.0 that corresponds to the GM’s portfolio. Competitive Impact is calculated as the product of two other indicators that we developed named Technology Relevance and Market Coverage. To learn more about our indicators and to see how the technology landscape of ‘e-Mobility’ evolved in the past decades, watch our recent webinar on this topic, by clicking on the button below.

It is safe to assume, that this difference in overall quality is due to the fact that Tesla has been developing a portfolio of patents, focusing only on electricity propelled vehicles and thereof. GM, on the other hand, has been developing technologies in both traditional combustion engines along with electric propulsion technologies. This lack of focused innovation by GM could have resulted in such subpar patents that bring down the average quality of the entire portfolio.
What technology do they individually focus on?
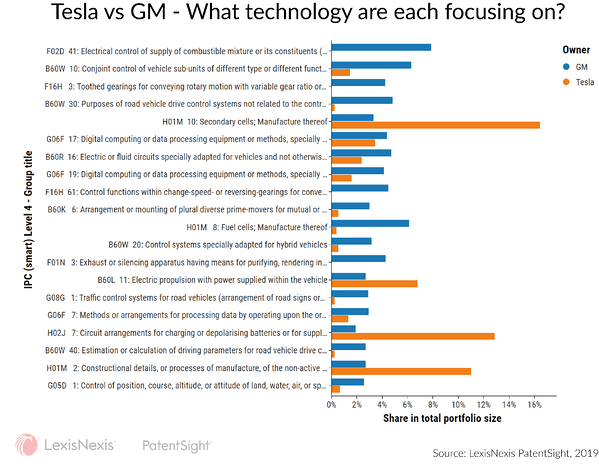
In order to examine the portfolios of these rivals in detail, and to verify our earlier assumption, we used a chart that groups the patents in each portfolio into different IPC classifications and then compares each individual group of both the owners, based on their number of patents in each technology. In this graph it becomes evident that while GM has been trying to maintain an even portfolio across the board, Tesla has been developing a focused portfolio of patents protecting electric propulsion and related technologies.

In technology classes related to combustion engine-related technology, like F02D 41, F16H 3, F16H 61 etc., as expected, Tesla can be seen to own no patents at all whatsoever. On the other hand, quite a large share (almost 25% cumulative) of GM’s portfolio is made up of such patents. Whereas, when it comes to technologies related to electric propulsion Tesla has a much larger share of patents in its portfolio as compared to GM. This is confirmation of our previous assumption that GM maintains a more even portfolio, with respect to both conventional and revolutionary technologies and Tesla has maintained its focus on electric vehicles.
How does the quality of GM’s technology compare to that of Tesla’s?
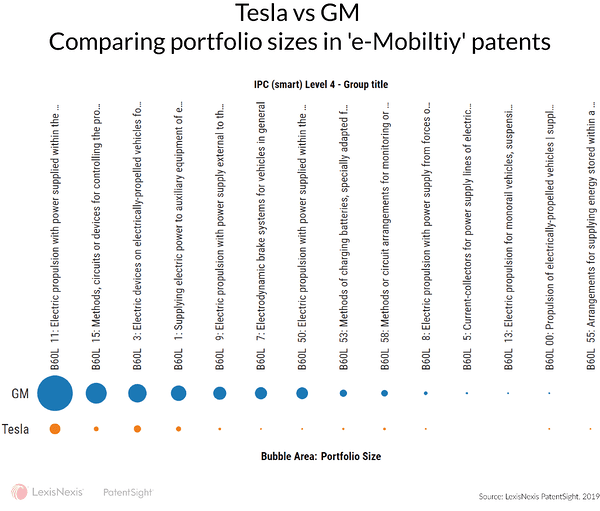
Since GM is also developing a portfolio of patents in electric propulsion and related technologies, we figured it would be worthwhile to compare the 2 companies based on their portfolios in this technology. To make this comparison wholesome, we evaluated the portfolios based on both quantity and quality, by using a simple technology matrix chart to compare both the manufacturers’ portfolio of patents belonging to the IPC class B60L.

Surprisingly, GM has quite a large portfolio of patents in this technology, a considerable number greater over the Tesla portfolio. In almost all the sub-technologies under the definition IPC B60L. Based on a purely quantitative assessment, GM seems to be the leader in this technology. This does not make any sense when looking at the news about Tesla stocks.
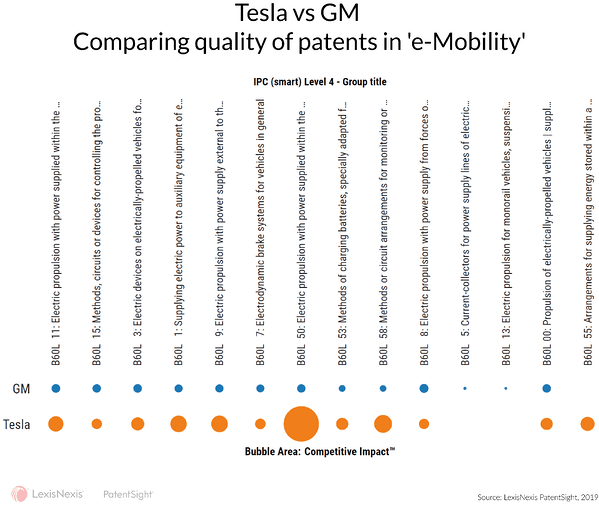
The cloud of confusion blows away, as we alter the filters of the same graph to include one of our scientifically proven indicators, Competitive Impact. When considering the quality of patents rather than the portfolio size, or quantity, the resulting picture is drastically different from the previous one. Although GM owns a larger portfolio of patents in ‘e-Mobility’, Tesla’s patents, despite being few in number are of very high quality as compared to the former. In almost all the sub-technologies, Tesla’s patents outperform that of GM’s. This is a direct validation of the quality of technology that Tesla has been developing.

We can study these portfolios in further detail, for e.g. looking at the geographical locations wherein each company focuses on protecting their inventions etc. Such analyses would provide us further insights into these portfolios and thus enable us to form a clear understanding of how Tesla achieved its current and ongoing success. It is also worth noting that since our patent data features ownership harmonization, GM’s portfolio that was analyzed includes patents filed under the names of all their subsidiaries and merged entities, for e.g. companies like Daewoo in Korea, SAIC in China etc.
Learn more about PatentSight.
Excellent data quality is the foundation of reliable analyses. Learn how PatentSight enhances patent data here.
About the author: Andreas Lübbering
Andreas is a Senior Consultant at LexisNexis PatentSight. Holding a degree in mechanical engineering and business administration, he makes sure that users are successful with PatentSight and gives professional support in their daily tasks.
